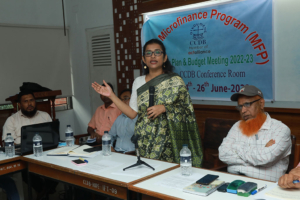
Microfinance Program (MFP).
When microfinance sector was recognized in Bangladesh, the main objective was to reduce poverty in rural areas by providing microcredit loans for non-farm activities like poultry, small business, livestock etc. Mainly the government of Bangladesh and bilateral donors funded these loans to the impoverished rural people to advance their life status. A research discloses that in the mid eighties the credit program was started by NGOs and their activities amplified strikingly higher after 1990 (CDF, 2000). CCDB is a non-government organization in Bangladesh which is operating microfinance program beside other at rural community as People Managed Savings and Credit (PMSC) and makes small and large loans for the rural people without requiring collateral. Its microfinance program was started in 2008 by reforming its Enterprise Development Program (EDP) and continuing successfully for organization sustainability.
Performance in the Last Five Years
| Sl. No. | Particulars | 2021-2022 | 2020-2021 | 2019-2020 | 2018-2019 | 2017-2018 |
|---|---|---|---|---|---|---|
| 1 | Number of Members | 12,542 | 12,017 | 12,446 | 12,651 | 12,522 |
| 2 | Number of Borrowers | 10,378 | 9,251 | 9,641 | 10,589 | 10,775 |
| 3 | Member Borrowers Ratio | 82.75 | 77:100 | 77:100 | 84:100 | 86:100 |
| 4 | Member Savings | 29,82,66,942 | 24,04,43,713 | 20,69,26,183 | 16,93,56,630 | 12,86,08,018 |
| 5 | Loan disbursement | 92,39,22,000 | 74,46,16,000 | 65,18,23,000 | 72,21,86,000 | 61,55,40,000 |
| 6 | Loan Realization | 79,90,81,469 | 69,75,40,623 | 60,65,50,746 | 65,94,89,074 | 58,33,68,546 |
| 7 | Portfolio in Tk. | 63,56,87,267 | 51,08,46,736 | 46,37,71,359 | 41,84,99,105 | 35,58,02,179 |
| 8 | Cost per money lent 100 Tk. | 9.22 | 9.88 | 10.20 | 8.28 | 8.97 |
| 9 | Portfolio Yield | 21.27% | 21.88% | 20.17% | 24.06% | 23.61% |
| 10 | On time recovery rate (OTR) | 98.43% | 95.32% | 99.49% | 99.49% | 99.46% |
| 11 | Cumulative recovery rate (CRR) | 99.33% | 99.30% | 99.69% | 99.48% | 99.41% |
| 12 | Portfolio in arrear | 5.19% | 7.05% | 2.94% | 3.05% | 3.20% |
| 13 | Portfolio at Risk | 6.19% | 14.76% | 3.19% | 3.36% | 3.41% |
| 14 | Income | 12,19,12,965 | 10,66,13,448 | 8,89,59,614 | 9,31,40,687 | 8,02,06,828 |
| 15 | Expenditure | 8,51,70,773 | 7,35,73,672 | 6,65,73,277 | 5,98,24,225 | 5,52,17,352 |
| 16 | Surplus | 3,67,42,193 | 3,30,39,775 | 2,23,86,337 | 3,33,16,462 | 2,49,89,476 |
| 17 | Operational Self Sufficiency (OSS) | 143% | 145% | 134% | 156% | 145% |
| 18 | Financial Self-sufficiency (FSS) | 116% | 118% | 109% | 126% | 116% |
| 19 | Loan Loss Reserve (LLR) | 2,67,14,919 | 2,20,96,965 | 1,69,73,230 | 1,58,04,503 | 1,43,00,089 |
| 20 | Debt Capital Ratio | 1.50:1 | 1.61:1 | 1.66:1 | 2.03:1 | 2.48:1 |
| 21 | Capital Adequacy Ratio | 41.60% | 41.05% | 39.71% | 41.38% | 29.22% |
| 22 | Minimum Rate of Return on Capital | 14.64% | 15.28% | 11.92% | 23.48% | 26.56% |
| 23 | Return on Asset (ROA) | 5.58% | 5.79% | 4.50% | 7.76% | 6.71% |
| 24 | Minimum Liquidity Ratio | 13.31% | 17.47% | 17.26% | 13.39% | 14.53% |
| 25 | Minimum Current Ratio | 1.99:1 | 1.65:1 | 1.68:1 | 1.11:1 | 1.41:1 |
| 26 | Minimum Debt service cover ratio | 1.37:1 | 1.39:1 | 1.33:1 | 1.28:1 | 1.20:1 |


